Abstract
Objective As biologic augmentation methods emerge, objective measures of soft tissues are necessary for developmental study. The purpose of this study was to develop a quantitative MRI mapping protocol for the ACL. The objectives were (1) to provide age-based T2 relaxation, T2* relaxation, and volume values in healthy individuals, (2) to establish the intra-rater and inter-rater reliability of ACL mapping, and (3) to determine whether 3-T or 7-T MRI is more appropriate for future clinical trials.
Materials and methods Thirty healthy participants, aged 18–62, asymptomatic for knee pathology and without history of knee injury underwent both a 3-T and 7-T MRI. Manual image mapping of the anterior cruciate ligament was performed by two observers and processed to obtain T2, T2*, and volume values. Analysis of variance and two-way random effects model were used to calculate statistical significance and intraclass correlation coefficients.
Results Across all participants, 3-T and 7-T mean T2, T2* and volume values were 37.1 ± 7.9 and 39.7 ± 6.2 ms (p = 0.124), 10.9 ± 1.3 and 10.9 ± 0.9 ms (p = 0.981), and 2380 ± 602 and 2484 ± 736 mm3 (p = 0.551), respectively. The T2, T2*, and volume did not vary between age cohorts (p > 0.05). Excellent inter-rater and intra-rater reliability regarding T2 and T2* values was found. While ACL volume exhibited good inter-rater reliability and excellent intra-rater reliability.
Conclusions T2 relaxation values and ACL volume do not vary with age and therefore can be used as a quantifiable, non-invasive method to assess ACL graft maturation. 7-T MRI analysis was not superior to 3-T MRI analysis, suggesting that 3-T MRI is practical and capable for future comparative studies.
Introduction
Anterior cruciate ligament (ACL) injuries are common in athletes, and MRI is the gold-standard imaging modality for the diagnosis of tears. ACL reconstruction is currently the preferred treatment of these injuries in athletes. After reconstruction, MRI is sometimes used as a non-invasive tool to assess the maturation of the ACL graft after reconstruction surgery, when managing postoperative recovery, and/or when studying surgical techniques [1–4]. However, interpretation in these settings is underdeveloped. Further development would provide more established methods for clinicians and researchers. Quantitative values in a healthy population would provide clinicians with expected normative values. These values would be useful when studying graft maturation, developing rehabilitation protocols, or evaluating surgical techniques of ACL reconstruction.
Authors: Adam W. Anz1 & Jos Edison2 & Thomas S. Denney3 & Eric A. Branch1 & Christopher R. Walz3 & Kenny V. Brock2 & Michael D. Goodlett4
Received: 29 January 2019 / Revised: 13 August 2019 / Accepted: 15 August 2019 / Published online: 3 September 2019
© ISS 2019
Keywords ACL · Magnetic resonance imaging · Structural properties · T2 relaxation time
1 Andrews Institute for Orthopaedics & Sports Medicine, 1040 Gulf Breeze Parkway, Gulf Breeze, FL 32561, USA
2 Edward Via College of Osteopathic Medicine, 910 South Donahue Drive, Auburn, AL 36832, USA
3 Department of Electrical and Computer Engineering, Auburn University, 200 Broun Hall, Auburn, AL 36849, USA
4 Auburn University Athletics, Auburn Athletics Complex, 392 S Donahue Drive, Auburn, AL 36849, USA
Jos Edison jedison@auburn.vcom.edu
Thomas S. Denney dennets@auburn.edu
Eric A. Branch eabranch@gmail.com
Christopher R. Walz cwalz@uab.edu
Kenny V. Brock kbrock@auburn.vcom.edu
Michael D. Goodlett goodlmd@auburn.edu
Biochemical changes of tissue can be measured through T2 and T2* relaxation times, which are influenced by the orientation of collagen, collagen content, and tissue hydration [5, 6]. Quantitative approaches using relaxation times instead of signal intensity allows resulting data to be independent of equipment or acquisition parameters, and solely dependent on magnet strength for cross-study comparison validity [6–9]. Quantitative MRI mapping, often calculating T2, T2*, and volume, has been developed in pre-clinical animal and human clinical studies to evaluate cartilage and tendon tissue [10–18]. The majority of investigations have examined the structure of cartilage in settings of osteoarthritis and cartilage repair [19, 20]. Soft tissue study is emerging, including study on the structural variation of tendons in a rabbit model, as well as normative values of the rotator cuff and cervical intravertebral discs in humans [15, 17, 21, 22]. Methods often require the creation of a T2 map, a 3-D model of the structure being evaluated. The output of quantitative mapping and processing is an image matrix (T2 mapping) where each pixel has a value in milliseconds. Application to the ACL is limited with early studies validating the ability of mapping techniques to predict the strength and structural properties of an ACL graft after reconstruction [6, 23–25]. However, as human normative values have not been established, it is unclear whether values change with age, and comparison of mapping on 3-T to 7-T magnet strength is lacking.
The purpose of this study was to further develop a quantitative MRI mapping protocol for the ACL. The objectives were three-fold: (1) to provide age-based T2 relaxation, T2* relaxation, and volume values in healthy individuals, (2) to establish the intra-observer and inter-observer reliability of ACL mapping, and (3) to determine whether 3-T or 7-T MRI would be more appropriate for future clinical trials. We hypothesized that: (1) compositional changes due to aging would be observed between three age cohorts and reflected by varying values with age, (2) T2 mapping would be reliable, and (3) data obtained on a 7-T MRI machine would be more reliable than data from a 3-T MRI machine.
Materials and methods
Participant recruitment and selection
The university’s Institutional Review Board approved the study protocol, and activities have been performed in accordance with the 1964 Declaration of Helsinki. A sample size of 30 was chosen based upon sample sizes for similar MRI research studies [8, 10, 13, 26]. Recruitment for volunteers was performed by word of mouth with a financial incentive. Thirty participants between the ages of 18 and 62 with an asymptomatic, non-injured knee were recruited into three age cohorts: 18–32, 33–46, and 47–62 years. Recruitment proceeded until ten subjects were recruited into each age cohort. Prior to data collection, all testing procedures were explained and informed consent was obtained from all individual participants included in the study. Exclusion criteria included patients with a self-reported history of being treated for osteoarthritis, rheumatoid arthritis, crystalline joint disease (e.g., gout, pseudogout), calcific tendonitis, or history of any injury to the study knee. Participants were also excluded from the study if MRI safety could not be ascertained based upon the institution’s health history questionnaire. The participants had to have one knee that met the inclusion criteria in order to participate. If both knees met the inclusion criteria, then the participant’s right knee was chosen to be scanned. Data were collected from April 9, 2016 to August 31, 2017. Participants were selected sequentially as they presented as a consecutive series. No medical evaluations or recommendations were promised; however, any incidental pathology that was discovered was reported to the participant by a reviewing physician.
Subject questionnaires and physical examination
On one visit to the Auburn University MRI Research Center, subjects completed an International Knee Documentation Committee (IKDC) questionnaire and a short activity questionnaire, had a physical examination, and underwent a 3-T MRI scan and a 7-T MRI scan. The IKDC questionnaire results in a scaled number that ranges from 0 to 100; interpreted as a measure of function with higher scores representing higher levels of function [27]. Physical examinations were performed by an experienced orthopedist, with at least 6 years of post-training clinical practice (AWA, JE). The physical exam consisted of palpation (medial and lateral joint line, Gerdy’s tubercle, pes anserine, patellar tendon, patella, fibular head, tibial tubercle, anterior knee, posterior knee), patella mobility, presence of crepitus, ligament examination (varus/valgus stress test, anterior drawer, posterior drawer, anterior/medial rotary instability, posterior/lateral rotary instability, pivot shift, and dial test), McMurrays test, posterior sag test, patella apprehension test, and observation for a J-sign.
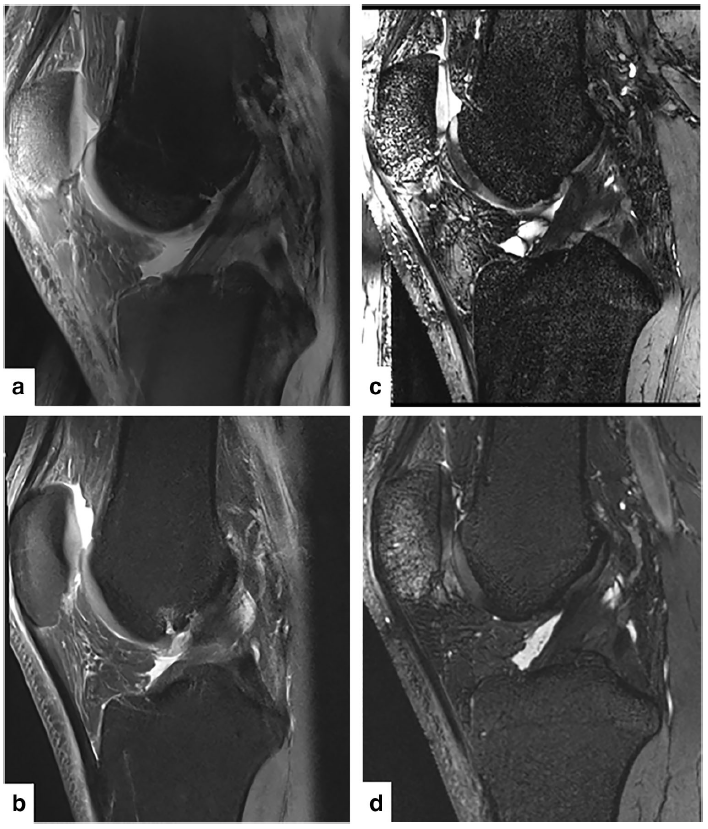
Fig. 1 Subjects underwent an MRI scan on one knee with a 3-T scanner and a 7-T scanner. Sequences included a sagittal PD TSE FS, a 7-T representative image and b 3-T representative image, and a sagittal T2 TRUFI sequence, c 7-T representative image and d 3-T representative image.
Image acquisition
3-T MR imaging was performed on a 3-T MAGNETOM Verio (Siemens Healthineers, Erlangen, Germany) with a 15-channel QED knee coil (Quality Electrodynamics, LLC, Mayfield Village, OH, USA). 7-T MR imaging was performed on a Siemens 7-T MAGNETOM scanner (Siemens Healthineers, Erlangen, Germany) with a 28-channel QED knee coil (Quality Electrodynamics, LLC, Mayfield Village, OH, USA) (Fig. 1). On the 3-T scanner, T2 mapping data were acquired in oblique planes, parallel to the ACL with a 2D spin-echo sequence with seven echo times (TEs) (13.8, 27.6, 41.4, 55.2, 69.0, 82.8, and 96.6 ms) [15], repetition time (TR) = 2570 ms, field of view = 140 × 140 mm, pixel spacing: 0.55 × 0.55 mm. Eleven slices were acquired with a slice thickness of 2 mm and 2 mm between slices in 6:53 min:s. T2* mapping data were acquired in oblique planes parallel to the ACL with a 3D spoiled gradient echo sequence with 5 TEs (4.36, 11.90, 19.44, 26.98, and 34.52 ms), TR = 41.0 ms, FOV = 160 × 160 mm, pixel spacing: 0.42 × 0.42 × 2 mm. Two slices were acquired in 4:13 min:s. High-resolution anatomical data were acquired in a sagittal view with a 3D TRUFISP sequence with TE = 3.3 ms, TR = 7.5 ms, flip angle = 30°, field of view = 192 × 192 × 90, pixel spacing: 0.43 × 0.43 × 0.43 mm [28]. A total of 208 slices were acquired in 9:25 min:s. On the 7-T scanner, T2 mapping data were acquired in oblique planes, parallel to the ACL with a 2D spin-echo sequence with 7 TEs (11.9, 23.8, 35.7, 47.6, 59.5, 71.4, and 83.3 ms), TR = 4060 ms, field of view = 140 ×
140 mm, pixel spacing: 0.44 × 0.44 mm. Eleven slices were acquired with a slice thickness of 3 mm and 3 mm between slices in 11:36 min:s. T2* mapping data were acquired in oblique planes parallel to the ACL with a 3D spoiled gradient-echo sequence with six TEs (3.65, 9.74, 15.83, 21.92, 28.01, and 34.10 ms), TR = 38 ms, FOV = 160 × 160 mm, pixel spacing: 0.42 × 0.42 × 0.42 mm. Eight slices were acquired in 6:12 min:s. High-resolution anatomical data were acquired in a sagittal view with a 3D TRUFISP sequence with TE = 2.8 ms, TR = 6.5 ms, flip angle = 19°, field of view = 129 × 129 × 102, pixel spacing: 0.40 × 0.40 × 0.40 mm [28]. A total of 256 slices were acquired in 5:34 min:s. The sequence in Fig. 2 constrained the maximum in-plane matrix size to 320 × 320, so an in-plane FOV of 129 × 129 was specified to keep the in-plane pixel spacing at 0.4 × 0.4 mm. This resulted in some wrap-around artifact, but this was considered acceptable because the artifact was far away from the ACL.
Observations and image processing
Image processing was performed by one orthopedic surgeon and one musculoskeletal radiologist in order to ascertain inter-rater reliability for the protocol. The orthopedic surgeon was previously trained by a musculoskeletal radiologist as part of two previous studies, and the orthopedic surgeon trained the musculoskeletal radiologist for this study [5, 29]. Each observer performed manual image processing for each scan. Processing was performed individually and independently, i.e., the observers did not perform the processing together. To determine intra-rater reliability, one observer, (Investigator Initials – Redacted), segmented all 30 scans from the 3-T twice and all 30 scans from the 7-T twice. The second observations were performed 30 days after the first observations.
Image processing was performed by manually drawing a region of interest (ROI) around the ACL on each image where the ACL was visible on the 3D TRUFISP series. The TRUFISP series was selected as previous authors have asserted that this sequences best highlights the difference between the ACL and surrounding structures, including synovial fluid [30]. Segmenting was performed in OsiriX (Pixmeo, Geneva, SUI) (Fig. 3a). The observers performing the image processing were blinded to what age group each participant was assigned. A three-parameter single exponential decay model was fit to the T2 or T2* data in each voxel of the ACL segmentation (Fig. 3b).
y = e(−t/B) + C
Volume was calculated by summing the total number of ACL graft voxels. The segmentations defined on the 3D True FISP could not be directly used on the T2/T2* mapping images because they had differences in slice prescriptions and voxel sizes. Consequently, custom software written in Matlab (MathWorks, Inc. Natick, MA, USA) was used to account for the these differences while transferring the segmentations to the T2/T2* mapping images. Customized software using Matlab (MathWorks, Natick, MA, USA) was used to calculate the mean T2 values and standard deviation for each clinically relevant sub-region.
Statistical analysis
The mean and 95% confidence interval was calculated for the ACL volume and T2 relaxation values for the entire sample population and three individual age cohorts. One-way analysis of variance was used to evaluate if there were differences in ACL volume, T2 relaxation values, and T2* relaxation values between the age cohorts for both the 3-T and 7-T scanners. A two-way random effects model was used to calculate the single measures intra-class correlation coefficient (ICC) for each variables mean value. The ICC values were graded as follows: excellent reliability (0.75 > ICC ≤ 1), fair to good reliability (0.4 ≥ ICC ≤ 0.75), and poor reliability (0 ≥ ICC < 0.4) [31, 32].
Results
The 30 subjects included 22 males and eight females. The final age range of the youngest cohort group was 20–27, the middle cohort was 34–45, and the oldest cohort was 47–56. Twenty-seven of the knees scanned were right knees, and three knees were left knees. No participants were excluded secondary to incidental findings on MRI. Demographics and IKDC data are presented in Table 1.
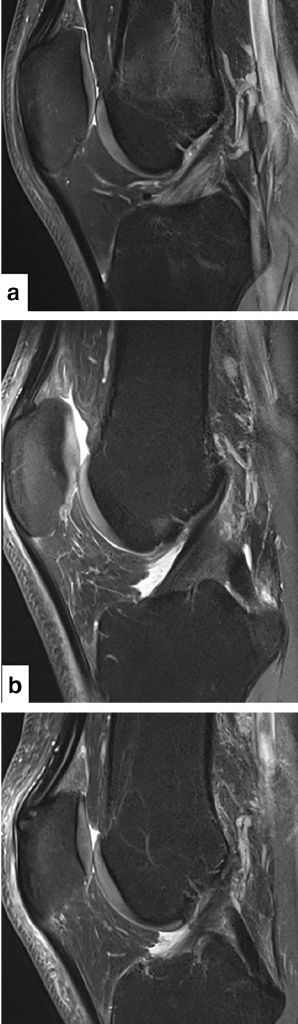
Fig. 2 Sagittal PD TSE FS images of a patient in the 18–32 year cohort (a), 33–46 year cohort (b), and 47–62 year cohort (c)
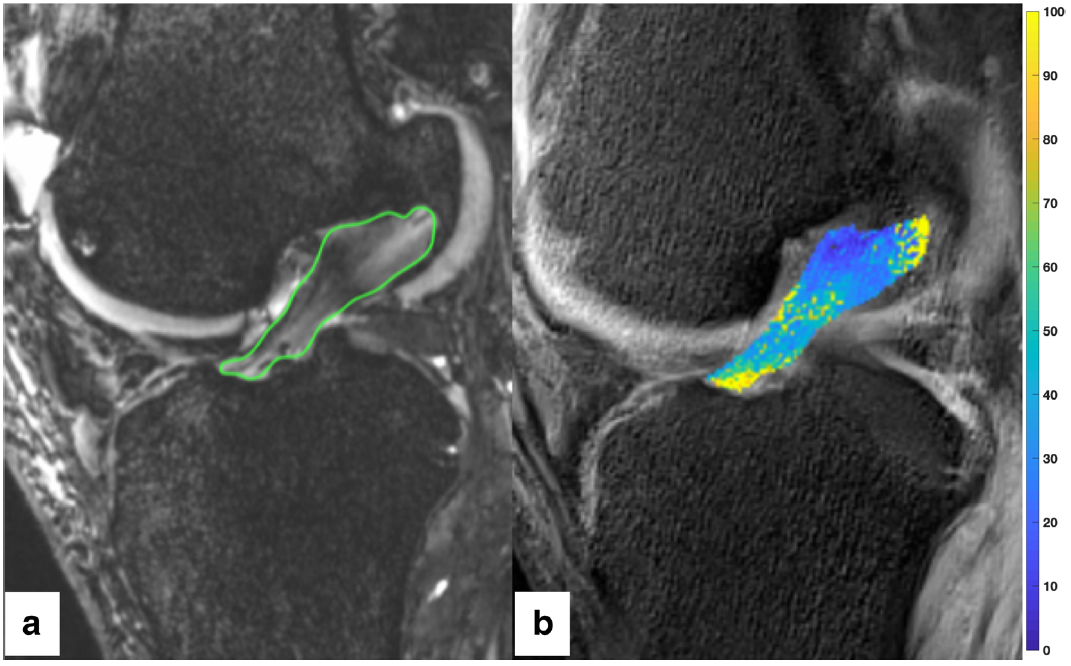
Fig. 3 a Segmenting was performed by circumscribing the ACL on each slice of the sagittal TRUFI 3D sequence for each scan, creating a region of interest. This was repeated for each image in the sagittal TRUFI 3D sequence creating a 3D region of interest. b The 3D region of interest was transferred to the T2 mapping images. The color bar scale on the right shows the distribution of T2 values
Self-reported activity and IKDC summary
Self-reported activity level was documented as follows: ten participants selected “Extreme”, 14 “Moderate”, and six “Mild”. Days per month which the subjects participate in exercise was reported: seven subjects exercising greater than 22 days per month, eight exercise 15–21 days per month, six exercise 8–14 days per month, and nine exercise less than 8 days per month. Reporting on “Highest Level of Activity on a Regular Basis” produced: nine participants selected “Very Strenuous”, 0 selected “Strenuous”, 16 selected “Moderate”, and five selected “Light” activity. The IKDC Knee Scores included a mean of 99.43 ± 0.01 (mean ± 95% CI) in the 18 to 32 year old grouping, 94.71 ± 0.05 in the 33 to 46 year old grouping, and 97.47 ± 0.02 in the 47 to 62 year old grouping. There was no significant difference between the age cohorts (p = 0.351, 0.999, 0.365) Table 1.
T2, T2*, and volume results
Values for ACL volumes, T2 and T2* ACL relaxation times for each age cohort and the entire sample are presented in Tables 2 and 3 for 3-T and 7-T MRI observations, respectively. Across all participants, the mean ± standard deviation T2 relaxation values in the 3-T and 7-T scans were 37.1 ± 7.9 and 39.7 ± 6.2 ms, with no significant difference calculated (p = 0.124). The T2* relaxation values in the 3-T and 7-T scans were 10.9 ± 1.3 and 10.9 ± 0.9 ms, with no significant difference calculated (p = 0.981). The volumes in the 3-T and 7-T scans were 2380 ± 6023 and 2484 ± 736 mm3 with no significant difference calculated (p = 0.551). The T2 relaxation time, T2* relaxation time, and volumes did not vary with age (p > 0.05).
| Cohort | (i) 18–32 years old (n = 10) | (ii) 33–46 years old (n = 10) | (iii) 47–62 years old (n = 10) | All sample (n = 30) |
|---|---|---|---|---|
| Average age | 24.0 ± 1.6 | 40.3 ± 2.3 | 51.3 ± 2.1 | 38.5 ± 4.2 |
| Age range (years) | 20–27 | 34–45 | 47–56 | 20–56 |
| Sex (males/female) | 6/4 | 8/2 | 8/2 | 23/7 |
| Mass (kg) | 66.2 ± 5.6 | 92.0 ± 12.4 | 87.6 ± 6.4 | 82.0 ± 6.3 |
| vs. (ii) p = 0.005 | vs. (iii) p = 0.978 | vs. (i) p = 0.009 | ||
| IKDC score | 99.43 ± 0.01 | 94.71 ± 0.05 | 97.47 ± 0.02 | 97.20 ± 0.02 |
| vs. (ii) p = 0.351 | vs. (iii) p = 0.999 | vs. (i) p = 0.365 |
Inter-rater reliability results
Excellent inter-rater reliability was observed for T2 relaxation time with 3-T (ρ = 0.97, 95% CI: 0.95–0.99) and 7-T (ρ = 0.98, 95% CI: 0.96–0.99) MRI. Similar results were observed for T2* relaxation times for 3-T (ρ = 0.90, 95% CI: 0.79–0.95) and 7-T (ρ = 0.99, 95% CI: 0.98–1.00) MRI. Excellent inter-rater agreement for ACL volume was observed with 3-T (ρ = 0.79, 95% CI: 0.56–0.90) and with good inter-rater agreement observed for 7-T (ρ = 0.72, 95% CI: 0.43–0.87) MRI. Values are presented in Table 4.
Intra-rater reliability results
Excellent intra-rater reliability was observed for T2 relaxation time with 3-T (ρ = 0.98, 95% CI: 0.97–0.99) and 7-T (ρ = 0.98, 95% CI: 0.96–0.99) MRI. Similar results were observed for T2* relaxation time for 3-T (ρ = 0.98, 95% CI: 0.96–0.99) and 7-T (ρ = 1.00, 95% CI: 0.99–1.00) MRI. ACL volume had excellent reliability for both 3-T (ρ = 0.95, 95% CI: 0.89–0.97) and 7-T (ρ = 0.95, 95% CI: 0.89–0.98) MRI scans. Values are presented in Table 4.
Discussion
The most important finding of this study was that ACL mapping produced excellent intra-rater reliability for volume, T2 and T2* values, and excellent inter-rater reliability for T2 and T2* relaxation values on both 3-T and 7-T MRI. These results indicate that ACL mapping is reliable on a 3-T MRI, a more common modality than 7-T MRI, and relevant when considering future clinical trials. The normative values and lack of variation with age provide clinicians and researchers information when designing future clinical trials with MRI as an objective outcome measure. ACL mapping exhibited good inter-rater reliability for volume, suggesting some variation among observers for what was considered ACL tissue. Considering recent scanning electron microscopy data confirming an overlap of the anterior lateral meniscus root with the tibial origin of the ACL, variation between observers when mapping the ACL is understandable [33]. Caution should be used in using multiple observers in future studies using ACL volume as an outcome measure.
Preclinical animal models have investigated the ability of MRI to predict ACL tissue quality. Weiler et al. investigated correlation between 1.5 T, contrast-enhanced MRI scans with histology, and biomechanical properties after ACL reconstruction in a sheep model [34]. High signal intensity values were associated with low load to failure, stiffness, and tensile strength values [34]. A similar study in a porcine ACL repair/reconstruction model evaluated modern MRI mapping techniques, with parameters of volume and signal intensity obtained in vivo [3]. Both the volume and signal intensity predicted the biomechanical properties of ex vivo tissue, and the combination of these two parameters in a multiple regression model was stronger than either metric alone [3].
The clinical application of ACL mapping as an outcome measure after ACL reconstruction in humans is still developing. Biercevicz et al. evaluated ACL mapping, with parameters of volume and signal intensity, in a cohort of 90 patients initially enrolled in a study investigating the effects of graft tension on 3-year and 5-year outcomes [2]. Twenty-three subjects had complete 3-year data and 17 subjects had complete 5-year data. In regression analysis at 3 years and 5 years, combining graft volume with signal intensity correlated with single leg hop test, and the regression analysis correlated with four out of the five Knee Injury and Osteoarthritis Outcome Score domains at 5 years but not at 3 years. At 5-year followup, larger grafts with lower median SI values were associated with better knee performance. This study questioned the ability of traditional outcome measures, such as 1-leg hop, anterior/posterior laxity, and Lachman test and patient-reported outcomes, to sensitively track ligamentization of the reconstructed ACL.
| T2*, ms | T2*, p value | T2, ms | T2, p value | Volume, mm3 | Volume, p value | |
|---|---|---|---|---|---|---|
| (i) 18–32 years old (n = 10) | 10.9 ± 0.5 [10.6, 11.2] | vs. (ii) p = 0.490 | 42.8 ± 7.1 [38.4, 47.2] | vs. (ii) p = 0.081 | 2322.8 ± 653.8 [1917.6, 2728.0] | vs. (ii) p = 0.154 |
| (ii) 33–46 years old (n = 10) | 10.6 ± 1.1 [10.0, 11.3] | vs. (iii) p = 0.387 | 36.9 ± 6.1 [33.1, 40.7] | vs. (iii) p = 0.320 | 2833.6 ± 905.4 [2272.5, 3394.8] | vs. (iii) p = 0.222 |
| (iii) 47–62 years old (n = 10) | 11.1 ± 1.1 [10.4, 11.8] | vs. (i) p = 0.677 | 39.3 ± 4.2 [36.7, 41.9] | vs. (i) p = 0.191 | 2295.6 ± 541.8 [1959.8, 2631.4] | vs. (i) p = 0.916 |
| Total sample (n = 30) | 10.9 ± 0.9 [10.6, 11.2] | – | 39.7 ± 6.2 [37.4, 41.9] | – | 2484.0 ± 735.9 [2220.7, 2747.3] | – |
| Cohorts | T2*, ms | T2*, p value | T2, ms | T2, p value | Volume, mm3 | Volume, p value |
|---|---|---|---|---|---|---|
| (i) 18–32 years old (n = 10) | 10.4 ± 1.1 [9.7, 11.1] | vs. (ii) p = 0.607 | 36.9 ± 7.3 [32.4, 41.5] | vs. (ii) p = 0.508 | 2225.0 ± 533.3 [1894.5, 2555.6] | vs. (ii) p = 0.092 |
| (ii) 33–46 years old (n = 10) | 10.8 ± 1.5 [9.8, 11.7] | vs. (iii) p = 0.209 | 39.8 ± 10.6 [33.2, 46.3] | vs. (iii) p = 0.213 | 2694.5 ± 730.2 [2241.9, 3147.1] | vs. (iii) p = 0.179 |
| (iii) 47–62 years old (n = 10) | 11.5 ± 1.2 [10.8, 12.2] | vs. (i) p = 0.060 | 34.7 ± 4.6 [31.9, 37.5] | vs. (i) p = 0.438 | 2219.8 ± 430.7 [1952.8, 2486.7] | vs. (i) p = 0.980 |
| Total sample (n = 30) | 10.9 ± 1.3 [10.4, 11.4] | – | 37.1 ± 7.9 [34.3, 40.0] | – | 2379.8 ± 602.1 [2164.3, 2595.2] | – |
Table 4 Inter and intra-rater intraclass correlation coefficient and confidence intervals
| MRI strength | Variable | Intra-rater ICC | 95% CI | Inter-rater ICC | 95% CI |
|---|---|---|---|---|---|
| 3 T | Volume | 0.95 | 0.89–0.97 | 0.79 | 0.56–0.90 |
| T2 | 0.98 | 0.97–0.99 | 0.97 | 0.95–0.99 | |
| T2* | 0.98 | 0.96–0.99 | 0.90 | 0.79–0.95 | |
| 7 T | Volume | 0.95 | 0.89–0.98 | 0.72 | 0.43–0.87 |
| T2 | 0.98 | 0.96–0.99 | 0.98 | 0.96–0.99 | |
| T2* | 1.00 | 0.99–1.00 | 0.99 | 0.98–1.00 | |
| ICC average and 95% confidence | |||||
While MRI mapping is still being developed, there are studies which have utilized MRI parameters for cohort analysis. Radice et al. compared ACL reconstruction with and without a platelet-rich plasma gel loaded onto a gelfoam carrier in 50 patients [1]. Graft maturation was observed through a subjective scoring performed by a musculoskeletal radiologist. Scores were assigned 0–3 with 0 being a perfectly homogenized graft. Similarly, Orrego et al. randomized 108 patients to ACL reconstruction with and without platelet concentrate clotted onto grafts. Grafts were subjectively dichotomized into two groups by a musculoskeletal radiologist evaluated as high-intensity signal or low-intensity signal [35]. Li et al. compared four MRI-measured parameters on 3-T scans to patient-reported outcomes and physical examination findings at 2 years [36]. MRI parameters included graft orientation, edematous condition of the graft, intra-articular graft width, and signal intensity measured, and the patient-reported outcomes included International Knee Documentation Committee and Tegner Lysholm Knee Scoring Scale, while physical examinations included anterior drawer test and Lachman testing. No differences were seen on patient-reported outcomes, physical examinations, or MRI measures with the exception of signal intensity, which was higher for the allograft group. This leads authors to conclude that MRI is sensitive to capturing biomechanical ligamentization of graft tissue while patient-reported outcomes and physical examination are not. Prior study has shown that physical exam lacks sensitivity in detecting critical graft mechanical properties of the post-operative ACL reconstruction as it progresses through ligamentization [2, 37]. Therefore, noninvasive MRI evaluation of the postoperative ACL reconstruction can provide valuable insight into the state of the reconstruction; with a prior study demonstrating correlation with signal intensity to graft maturity [2–4, 23–25, 34, 36, 38].
We hypothesized a change in quantitative ACL values with age; however, this was not observed. Our finding is similar to an investigation into MRI signal-to-noise quotient, which found it to be independent of patient age, sex, BMI, and smoking status [38]. By contrast, a study in 2012 correlated the severity of mucoid degeneration and chondroid metaplasia in the ACL with the number of lesions in the cartilage surrounding the structure [39]. Our results suggest that changes seen in other studies and clinical practice are secondary to degeneration of the joint seen with cartilage injury. Since these data were collected in verified asymptomatic participants by a reliable and repeatable method, the averages for T2 relaxation times and ACL volume determined by this study are values that can be used to determine the structure and health of the ACL. Furthermore, since there is no statistical difference between the averages of the individual cohorts, the overall average can be used as a single value. Lastly, since 7-T scanning failed to show significant difference from 3-T scanning in regard to calculating these values, these values can continue to be used as MRI technology continues to improve.
Limitations
There are study limitations that should be considered. This study lacked histologic data, and therefore the assumption that the study population represents normal, non-pathologic ACL tissue is determined by trusted patient reports and physical exam. The study did not have an a prior power analysis and thus may have been underpowered to adequately determine age-related variability between the age subgroups. Prior study has set acceptable group numbers at ten, which was the basis for study design as no data were available to perform an a priori power analysis [40]. To address this concern, the same MR imaging parameters and hardware were used throughout the study. Another limitation is that segmentation may include fat or other tissue around the ligament. The authors have access to and utilize a Cadaver lab routinely to perform anatomy and biomechanic study and consider the body of the ACL a distinct structure. This experience aided in the segmentation process.
This study lacks a comparison of quantitative MRI data with biomechanical measurements of ACL tissue; this limitation would require an ex vivo approach, which was not the intent of process development. The authors also recognize that quantitative measures due have limitations of approximation and by definition population-based qualitative studies are an approximation. Our comparison of 3-T to 7-T MRI involved
measures of volume, T2 values, and T2* values. The ultimate advantage of stronger MRI machines is functional and molecular imaging, i.e., biochemical imaging such as multinuclear imaging (sodium imaging) and gagCEST. The design followed precedent within the orthopedic literature and further study may develop biochemical and multinuclear imaging in this setting, which may find 7-T superior to 3-T MRI.
Conclusions
T2 relaxation values and ACL volume do not vary with age and therefore can be used as a quantifiable, non-invasive method to assess ACL graft maturation. 7-T MRI analysis was not superior to 3-T MRI analysis, suggesting that 3-T MRI is practical and capable for future comparative studies.
Funding information This study received funding from Edward Via College of Osteopathic Medicine- Auburn for participant incentive and donated MRI resources. Authors received no financial incentives or reimbursements.
Compliance with ethical standards
Ethical approval All procedures performed in studies involving human participants were in accordance with the ethical standards of the institutional and/or national research committee and with the 1964 Helsinki Declaration and its later amendments or comparable ethical standards.
Conflict of interest The authors declare that they have no conflicts of interest.
References
- Radice F, Yanez R, Gutierrez V, Rosales J, Pinedo M, Coda S. Comparison of magnetic resonance imaging findings in anterior cruciate ligament grafts with and without autologous platelet-derived growth factors. Arthroscopy. 2010;26(1):50–7.
- Biercevicz AM, Akelman MR, Fadale PD, Hulstyn MJ, Shalvoy RM, Badger GJ, et al. MRI volume and signal intensity of ACL graft predict clinical, functional, and patient-oriented outcome measures after ACL reconstruction. Am J Sports Med. 2015;43(3):693–9.
- Biercevicz AM, Miranda DL, Machan JT, Murray MM, Fleming BC. In situ, noninvasive, T2*-weighted MRI-derived parameters predict ex vivo structural properties of an anterior cruciate ligament reconstruction or bioenhanced primary repair in a porcine model. Am J Sports Med. 2013;41(3):560–6.
- Biercevicz AM, Murray MM, Walsh EG, Miranda DL, Machan JT, Fleming BC. T2 * MR relaxometry and ligament volume are associated with the structural properties of the healing ACL. J Orthop Res. 2014;32(4):492–9.
- Jordan CD, Saranathan M, Bangerter NK, Hargreaves BA, Gold GE. Musculoskeletal MRI at 3.0 T and 7.0 T: a comparison of relaxation times and image contrast. Eur J Radiol. 2013;82(5):734–9.
- Welsch GH, Apprich S, Zbyn S, Mamisch TC, Mlynarik V, Scheffler K, et al. Biochemical (T2, T2* and magnetisation transfer ratio) MRI of knee cartilage: feasibility at ultra-high field (7T) compared with high field (3T) strength. Eur Radiol. 2011;21(6):1136–43.
- Duewell SH, Ceckler TL, Ong K, Wen H, Jaffer FA, Chesnick SA, et al. Musculoskeletal MR imaging at 4T and at 1.5T: comparison of relaxation times and image contrast. Radiology. 1995;196:551–5.
- Mosher TJ, Liu Y, Torok CM. Functional cartilage MRI T2 mapping: evaluating the effect of age and training on knee cartilage response to running. Osteoarthr Cartil. 2010;18(3):358–64.
- Joseph G, Baum T, Alizai H, Carballido-Gamio J, Nardo L, Virayavanich W, et al. Baseline mean and heterogeneity of MR cartilage T2 are associated with morphologic degeneration of cartilage, meniscus, and bone marrow over 3 years–data from the osteoarthritis initiative. Osteoarthr Cartil. 2012;20(7):727–35.
- Welsch GH, Mamisch TC, Domayer SE, Dorotka R, Kutschalissberg F, Marlovits S, et al. Cartilage T2 assessment at 3-T MR imaging: in vivo differentiation of normal hyaline cartilage from reparative tissue after two cartilage repair procedures—initial experience. Radiology. 2008;247(1):154–61.
- White LM, Sussman MS, Hurtig M, Probyn L, Tomlinson G, Kandel R. Cartilage T2 assessment: differentiation of normal hyaline cartilage and reparative tissue after arthroscopic cartilage repair in equine subjects. Radiology. 2006;241(2):407–14.
- Dunn TC, Lu Y, Jin H, Ries MD, Majumdar S. T2 relaxation time of cartilage at MR imaging: comparison with severity of knee osteoarthritis. Radiology. 2004;232(2):592–8.
- Li X, Ma CB, Link TM, Castillo DD, Blumenkrantz G, Lozano J, et al. In vivo T1p and T2 mapping of articular cartilage in osteoarthritis of the knee using 3 T MRI. Osteoarthr Cartil. 2007;15(7):789–97.
- Oneto JMM, Ellermann J, LaPrade RF. Longitudinal evaluation of cartilage repair tissue after microfracture using T2-mapping: a case report with arthroscopic and MRI correlation. Knee Surg Sports Traumatol Arthrosc. 2010;18(11):1545–50.
- Anz AW, Lucas EP, Fitzcharles EK, Surowiec RK, Millett PJ, Ho CP. MRI T2 mapping of the asymptomatic supraspinatus tendon by age and imaging plane using clinically relevant subregions. Eur J Radiol. 2014;83(5):801–5.
- Helmer KG, Wellen J, Grigg P, Sotak CH. Measurement of the spatial redistribution of water in rabbit Achilles tendon in response to static tensile loading. J Biomech Eng. 2004;126(5):651–6.
- Riley GP, Harrall RL, Constant CR, Chard MD, Cawston TE, Hazleman BL. Glycosaminoglycans of human rotator cuff tendons: changes with age and in chronic rotator cuff tendinitis. Ann Rheum Dis. 1994;53(6):367–76.
- Lockard CA, Wilson KJ, Ho CP, Shin RC, Katthagen JC, Millett PJ. Quantitative mapping of glenohumeral cartilage in asymptomatic subjects using 3 T magnetic resonance imaging. Skelet Radiol. 2018;47(5):671–82.
- Snoj Ž, Vidmar J, Gergar M, Plut D, Salapura V. T2 distribution profiles are a good way to show cartilage regional variabilities and cartilage insufficiency. Berlin: Springer; 2019.
- Zhu J, Hu N, Liang X, Li X, Guan J, Wang Y, et al. T2 mapping of cartilage and menisci at 3T in healthy subjects with knee malalignment: initial experience. Skelet Radiol. 2019;48(5):753–63.
- Wellen J, Helmer KG, Grigg P, Sotak CH. Spatial characterization of T1 and T2 relaxation times and the water apparent diffusion coefficient in rabbit Achilles tendon subjected to tensile loading. Magn Reson Med. 2005;53(3):535–44.
- Driscoll SJ, Zhong W, Torriani M, Mao H, Wood KB, Cha TD, et al. In-vivo T2-relaxation times of asymptomatic cervical intervertebral discs. Skelet Radiol. 2016;45(3):393–400.
- Fleming BC, Vajapeyam S, Connolly SA, Magarian EM, Murray MM. The use of magnetic resonance imaging to predict ACL graft structural properties. J Biomech. 2011;44(16):2843–6.
- Niki Y, Yasuoka T, Kobayashi S, Harato K, Nagura T, Okuda S, et al. Feasibility of T1rho and T2 map magnetic resonance imaging for evaluating graft maturation after anatomic double-bundle
- anterior cruciate ligament reconstruction. J Orthop Surg Res. 2019;14(1):140.
- Beveridge JE, Machan JT, Walsh EG, Kiapour AM, Karamchedu NP, Chin KE, et al. Magnetic resonance measurements of tissue quantity and quality using T2* relaxometry predict temporal changes in the biomechanical properties of the healing ACL. J Orthop Res. 2018;36(6):1701–9.
- Apprich S, Welsch GH, Mamisch TC, Szomolanyi P, Mayerhoefer M, Pinker K, et al. Detection of degenerative cartilage disease: comparison of high-resolution morphological MR and quantitative T2 mapping at 3.0 Tesla. Osteoarthr Cartil. 2010;18(9):1211–7.
- Irrgang JJ, Anderson AF, Boland AL, Harner CD, Kurosaka M, Neyret P, et al. Development and validation of the international knee documentation committee subjective knee form. Am J Sports Med. 2001;29(5):600–13.
- Welsch GH, Juras V, Szomolanyi P, Mamisch TC, Baer P, Kronnerwetter C, et al. Magnetic resonance imaging of the knee at 3 and 7 Tesla: a comparison using dedicated multi-channel coils and optimised 2D and 3D protocols. Eur Radiol. 2012;22(9):1852–9.
- Ho CP, Surowiec RK, Ferro FP, Lucas EP, Saroki AJ, Dornan GJ, et al. Subregional anatomical distribution of T2 values of articular cartilage in asymptomatic hips. Cartilage. 2014;5(3):154–64.
- Duc SR, Pfirrmann CW, Koch PP, Zanetti M, Hodler J. Internal knee derangement assessed with 3-minute three-dimensional isovoxel true FISP MR sequence: preliminary study. Radiology. 2008;246(2):526–35.
- McGraw KO, Wong SP. Forming inferences about some intraclass correlation coefficients. Psychol Methods. 1996;1(1):30.
- Fleiss JL, Levin B, Paik MC. Statistical methods for rates and proportions. Hoboken: Wiley; 2013.
- Steineman BD, Moulton SG, Haut Donahue TL, Fontbote CA, LaPrade CM, Cram TR, et al. Overlap between anterior cruciate ligament and anterolateral meniscal root insertions: a scanning electron microscopy study. Am J Sports Med. 2017;45(2):362–8.
- Weiler A, Peters G, Maurer J, Unterhauser FN, Sudkamp NP. Biomechanical properties and vascularity of an anterior cruciate ligament graft can be predicted by contrast-enhanced magnetic resonance imaging. A two-year study in sheep. Am J Sports Med. 2001;29(6):751–61.
- Orrego M, Larrain C, Rosales J, Valenzuela L, Matas J, Durruty J, et al. Effects of platelet concentrate and a bone plug on the healing of hamstring tendons in a bone tunnel. Arthroscopy. 2008;24(12):1373–80.
- Li H, Tao H, Cho S, Chen S, Yao Z, Chen S. Difference in graft maturity of the reconstructed anterior cruciate ligament 2 years postoperatively: a comparison between autografts and allografts in young men using clinical and 3.0-T magnetic resonance imaging evaluation. Am J Sports Med. 2012;40(7):1519–26.
- Fleming BC, Fadale PD, Hulstyn MJ, Shalvoy RM, Oksendahl HL, Badger GJ, et al. The effect of initial graft tension after anterior cruciate ligament reconstruction: a randomized clinical trial with 36-month follow-up. Am J Sports Med. 2013;41(1):25–34.
- Rose M, Crawford D. Allograft maturation after reconstruction of the anterior cruciate ligament is dependent on graft parameters in the sagittal plane. Orthop J Sports Med. 2017;5(8):2325967117719695.
- Hasegawa A, Otsuki S, Pauli C, Miyaki S, Patil S, Steklov N, et al. Anterior cruciate ligament changes in the human knee joint in aging and osteoarthritis. Arthritis Rheum. 2012;64(3):696–704.
- Deoni SCL, Williams SCR, Jezzard P, Suckling J, Murphy DGM, Jones DK. Standardized structural magnetic resonance imaging in multicentre studies using quantitative T1 and T2 imaging at 1.5 T. Neuroimage. 2008;40(2):662–71.
Publisher’s note Springer Nature remains neutral with regard to jurisdictional claims in published maps and institutional affiliations.
For additional information on ACL knee injuries, or to learn more about what is involved during ACL reconstruction surgery, please contact the office of orthopedic knee surgeon, Dr. Adam Anz, serving the greater Pensacola, Gulf Breeze, and Gulf Coast communities.